Originally Posted by
Vadim  What about having the ability to show and hide items so that they don't clutter up the graph as much?
You can select "None" from the graph item drop down on the template window and it will delete that item from the graph.
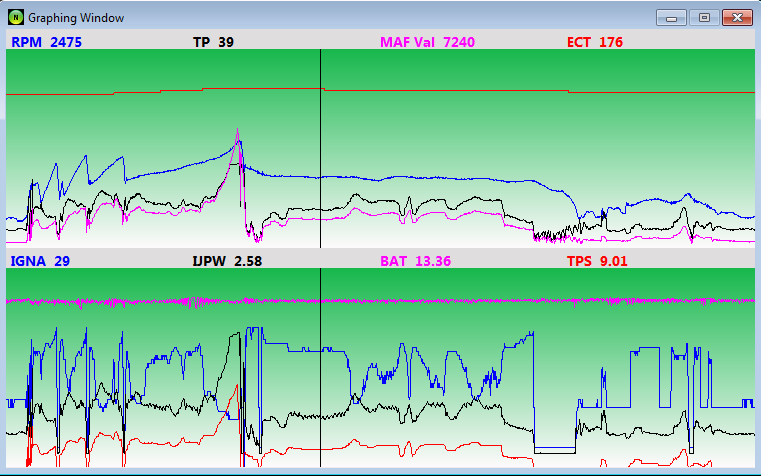
The graphs are fully definable, so you can have 0 to 4 items on it at any time.
So if you only want one item to be displayed, you only select one from the graph template, OR you can just put the max value to 0 or a negative number and that will zero out the graph but keep the actual log value displayed at the top.
This is the way it works.
1) Right click on graph Canvas ---> Add New graph
2) Right click on new graph -----> Define Graph Template (This opens up a new window)
3) Select as many items as you would like along with their color and max values.
4) Select your background colors for the graph
5) Hit Apply
6) Repeat for as many graphs as you would like to add.


 Be the first to like this post.


 Back to top
