Originally Posted by
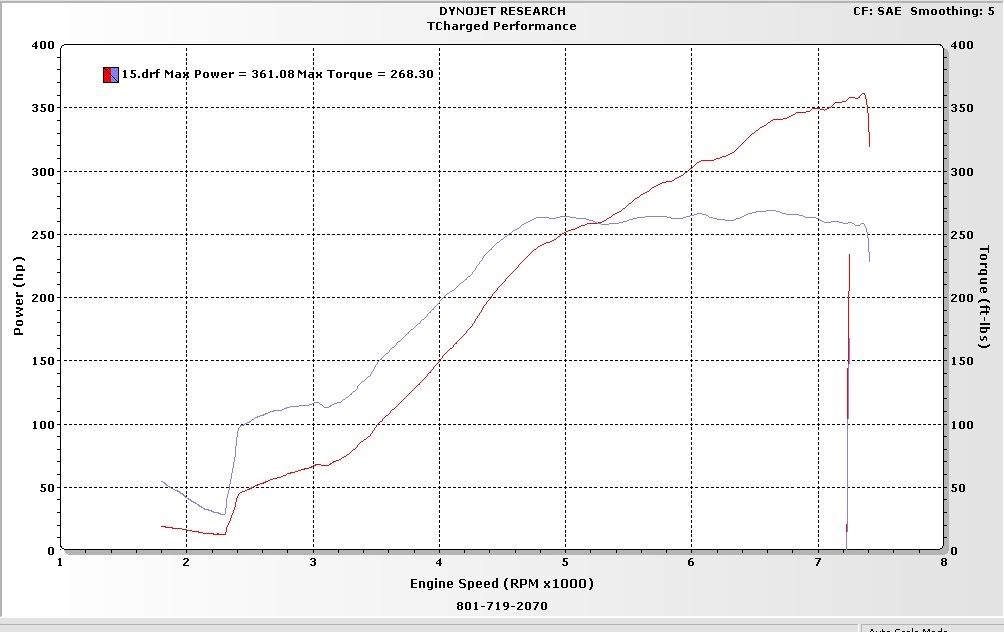
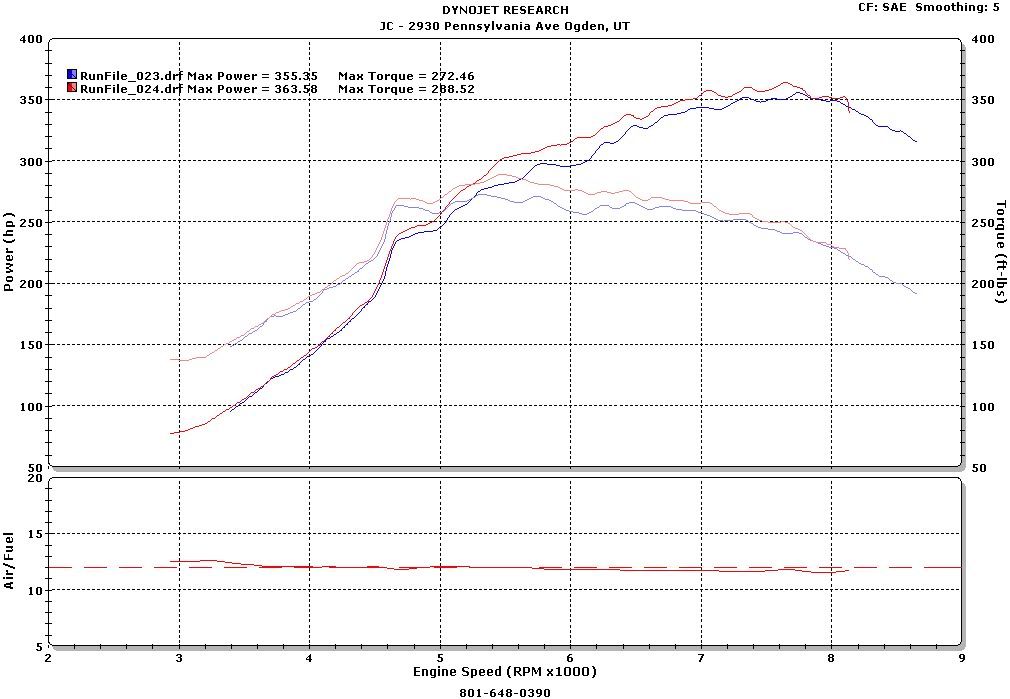
unijabnx2000  can you explain all the diff graph and numbers?
Edited to explain a little better.

Originally Posted by
SE-Rican  Was the 446 whp 401 tq run done today?
no, the 446whp run was a comparison to my older graph. Open DP, 25psi boost, 100 oct, 2.0 cams.

Originally Posted by
ashtonsser  Eh not bad, Your torque is very very close to your hp, That shows me your getting to the end of the efficiency of the turbo or close to it. You can see your torque is a good 80 ft-lbs less than your hp at the lower boost levels but once you broke the 400 mark your torque was moving closer and closer to your hp. Which at 446whp you made 401wtq.
how many psi was that at on the 446 run.
25psi, see above, that dyno was from october last year.

Originally Posted by
AndreasYou need to dyno this a little better.
You should have made dyno runs at 10 psi 15 psi and then 20 psi. and also have comparisons at the same boost level from before, comparing diffrent boost levels makes no sense.
Everything is a little confusing.
So far I got 308 WHP at 10 PSI
and
maybe 363 WHP at 14 PSI.
Ya, sorry it is a manual boost controller that I decided to change on the fly. Best run on 10psi was 317whp. Best run on 14psi was 363whp. Overall, power wasn't all that much different from my last fresh motor. The revs make it faster for sure, and it is making similar power on 2-3psi less boost.


 Be the first to like this post.


 Back to top
