


This log shows my point pretty well.
 Originally Posted by UNISA
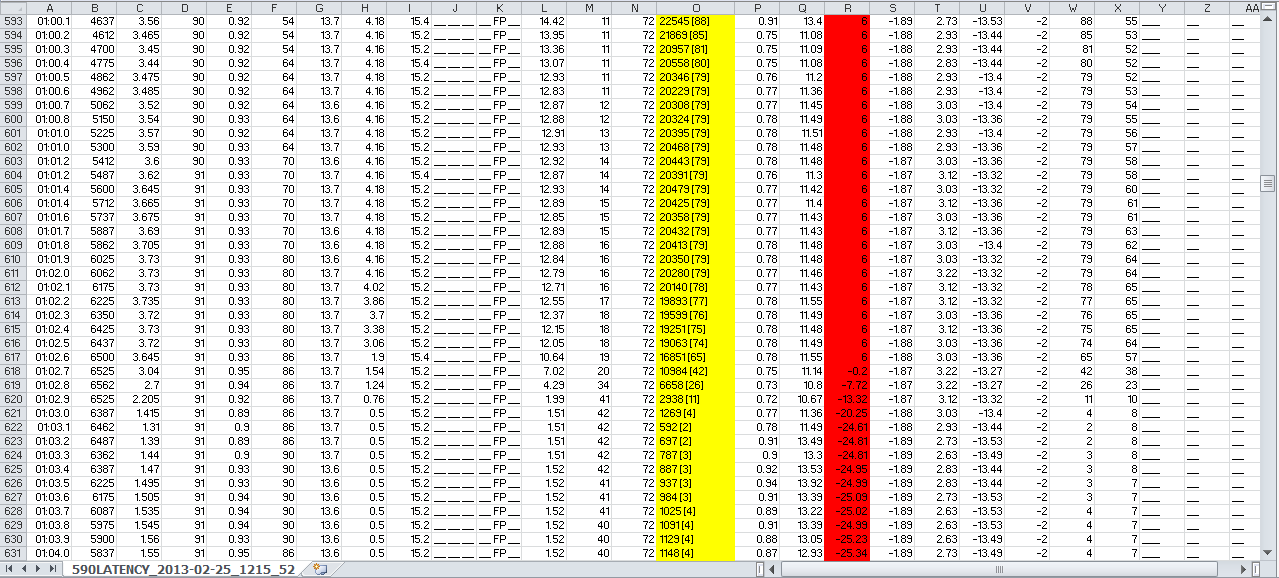
You go from 4,600 RPM to 6,500 RPM. Pressure stays rock solid at 6 (psi?).
Yet TP goes from 88 all the way down to 65.
You go from 4,600 RPM to 6,500 RPM. Pressure stays rock solid at 6 (psi?).
Yet TP goes from 88 all the way down to 65.
 Be the first to like this post.


