Welcome to the SR20 Community Forum - The Dash.
Register
SR20 forum logo

Thread: How to make your fuel and timing maps AKA "TP/LOAD" scales

+ Reply To Thread
Posts: 121-130 of 193
2013-02-28 23:07:52
#121
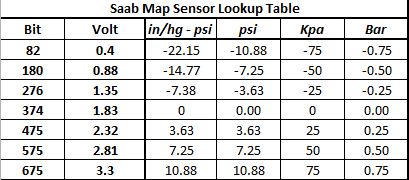
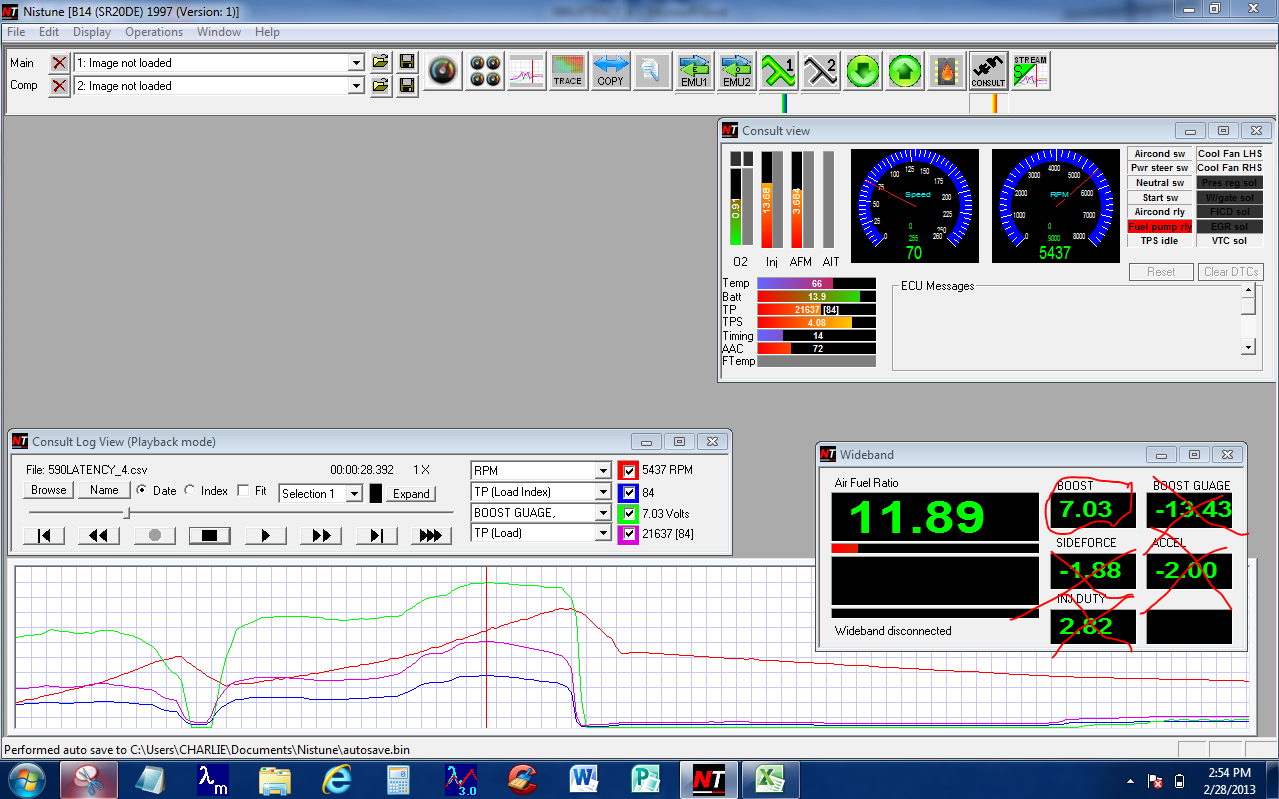
Ok I installed my SAAB MAP Sensor so I could rear positive boost pressures just a while ago and did a few runs, the following is actually a pull from around I think ~2.2k to about ~6.7k, I dont know but my MAP sensor curves follows TP Curve very nicely and as expected when tp increases so does map and vise versa, atleast its consistantly inconsistance by a couple TP.

I have it set to log in/hg to psi so the vacuum part of the log wont be as linear as if I had it log -psi to psi


Engine: USDM SR20DE(T) 9.5:1
Turbo: GTi-R T28
Intake: My own creation 3" piping with Apexi Dual Funnel Intake
Injectors: S15 448cc @ 3bar
Intercooler: FMIC and piping my own creation
Downpipe: 2.5" my own creation
Exhaust: Stock Cat-Back (for now)
Wideband: Innovate LM-2
MAF sensor: Z32
MAP sensor: Stock Nissan NA Map sensor for logging purposes (will upgrade to 3bar) NOW SAAB MAP SENSOR
Water Feed: Custom
Oil Feed: Custom
Last edited by UNISA JECS on 2013-02-28 at 23-31-32.
2013-02-28 23:11:57
#122
Originally Posted by BenFenner
Here is the DET with T25 at 7 psi. Again, I've put in a simulated MAP trace, and below you will find the expanded TP trace to compare similar scale with the torque curve.


Your MAP is really flat and doesn't follow TP very well at all, mines looks alot different than yours, what MAP sensor are you using, makes me wonder if maybe your voltage to pressure relationship is off or something.
2013-02-28 23:41:44
#123
That was a simulated (read: made up) MAP trace based on what I've seen over the past 6 years of working with MAP sensors and engines both N/A and boosted. Hopefully John or someone else can post a real log showing TP and MAP across a wide RPM range at WOT and then we can finally put this one to bed for you.

Edit: I did not see your newest data. Maybe the answer is in there.

Edit 2: Can you provide the numeric data logs of that run so we can run some statistics on it? Neither MAP nor TP holds steady so it would take the actual data and more complicated analysis to determine if they are correlated. Off the bat though I can tell you I see the telltale drop in TP without a corresponding nosedive in MAP readings at the end of your pull. TP drops 16.6% from peak to end of pull and MAP only drops 5% in the same RPM range. I know you think I'm splitting hairs, but this is important in my mind, and the repercussions one way or another are significant when it comes to tuning techniques.
Last edited by BenFenner on 2013-02-28 at 23-54-26.
2013-02-28 23:47:29
#124
Originally Posted by BenFenner
That was a simulated (read: made up) MAP trace based on what I've seen over the past 6 years of working with MAP sensors and engines both N/A and boosted. Hopefully John or someone else can post a real log showing TP and MAP across a wide RPM range at WOT and then we can finally put this one to bed for you.


Well what i posted is "real" and not simulated and is a pull from the low-mid 2k rpm range to about 6.7k rpm.
2013-02-28 23:53:23
#125
Originally Posted by BenFenner
That was a simulated (read: made up) MAP trace based on what I've seen over the past 6 years of working with MAP sensors and engines both N/A and boosted. Hopefully John or someone else can post a real log showing TP and MAP across a wide RPM range at WOT and then we can finally put this one to bed for you.

Edit: I did not see your newest data. Maybe the answer is in there.

Edit 2: Can you provide the numeric data logs of that run so we can run some statistics on it? Neither MAP nor TP holds steady so it would take the actual data and more complicated analysis to determine if they are correlated. Off the bat though I can tell you I see the telltale drop in TP without a corresponding nosedive in MAP readings at the end of your pull. TP drops 16.6% from peak to end of pull and MAP only drops 5% in the same RPM range.


I have to get ready for work but i''ll be more than happy to do logs and what not and explain the drop off's.
2013-02-28 23:54:47
#126
But I will say this, i think in yorus guy's quest to find out the answer a pressure conversion is needed.
2013-03-01 00:43:07
#127
Originally Posted by UNISA
I have to get ready for work but i''ll be more than happy to do logs and what not and explain the drop off's.


The drop off is fairly simple to explain actually and isn't anything you are necessarily doing, it is simply the way TP is calculated and TP will generally start to fall as soon as tq starts to drop.

If you think about it, it is actually pretty simple to explain.

The TP follows the tq curve and your tq curve is what dictates the amount of fuel being used (more tq = more fuel) and TP is a direct relation to injector pulsewidth you can make the relation here very quickly.

Now this is NOT the case with a map sensor or speed density car or map readings in general. On most cars the boost pressure will stay the same BUT tq will fall on the top end, at this time TP will fall and it will not longer follow the boost pressure relationship.

I will post up some more detailed logs tomorrow when I get a chance, but do note that the idea he is presenting here ISN'T a bad one per say. It does get you in the right direction but ISN'T completely accurate in all cases/examples and this it the main fault.
2013-03-01 03:01:44
#128
Here are some scatter plots of MAP vs. TP and MAP vs. MAF Q. These were made using over 15000 data points collected over a 30 minute drive with varying load, rpm, throttle and speed conditions.

Dave
2013-03-01 03:16:27
#129
lol... damn! calling BENFENNER!
2013-03-01 03:33:43
#130
Thanks Dave. Can't say I'm surprised your data corroborates what I've been saying in here.
I can see 85 kPa on your scatter plot being both 35 TP and all the up to 120 TP, and anything in between.
And 60 kPa can be anything from 10 TP to 80 TP.
And maybe most relevant to people here, your 160 kPa data shows a swing of around 20 TP which means you could have anywhere from 100 TP to 120 TP all while being at 160 kPa.

Hard to argue with that scatter plot.
Last edited by BenFenner on 2013-03-01 at 13-58-36.
+ Reply To Thread
  • [Type to search users.]
  • Quick Reply
    Thread Information
    There are currently ? users browsing this thread. (? members & ? guests)
    StubUserName

    Back to top